The 2025 Comprehensive College Scholarship Statistics Report


I'm Elise, a graduate from NYU, one of the most expensive schools in America. I spent over 20 hours researching and verifying the most up-to-date data on scholarships and college affordability to create this 2025 College Scholarship Statistics Report.
This report covers everything from average scholarship amounts and award rates to demographic disparities and financial aid trends. This research aims to make your job easier by providing clear, verifiable statistics and key takeaways that cut through the noise.
Accuracy and transparency are important. I sourced the data in this report from the U.S. Department of Education, National Center for Education Statistics, and other organizations with a demonstrated interest in democratizing education data.
Key Scholarship Statistics (Updated 2025)
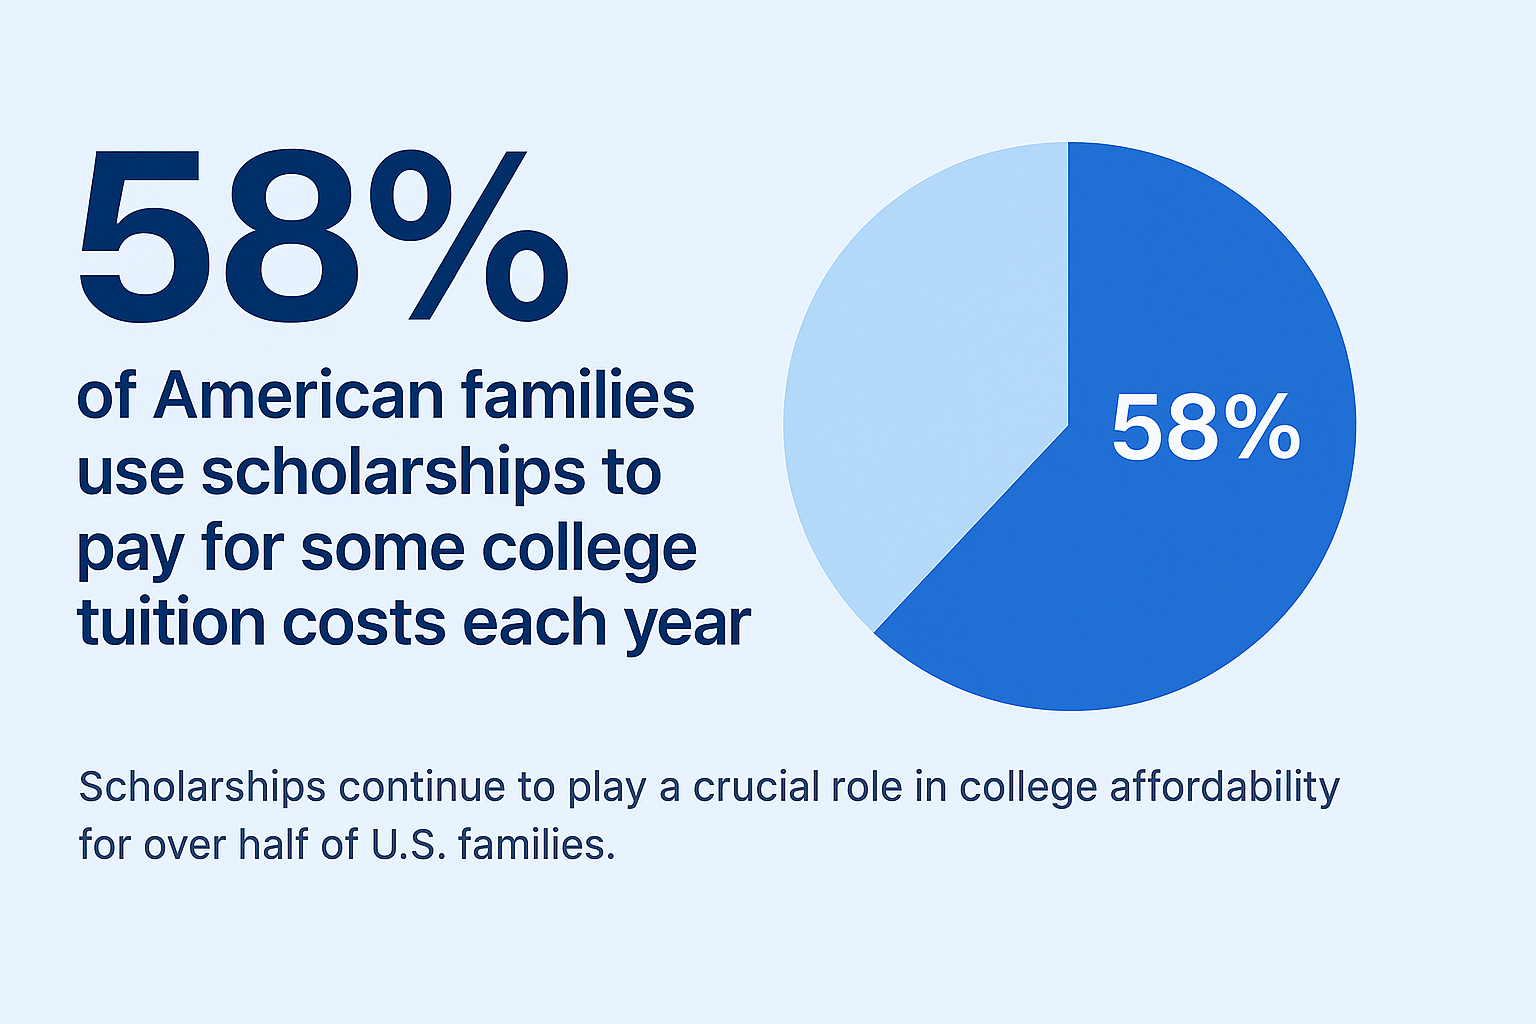
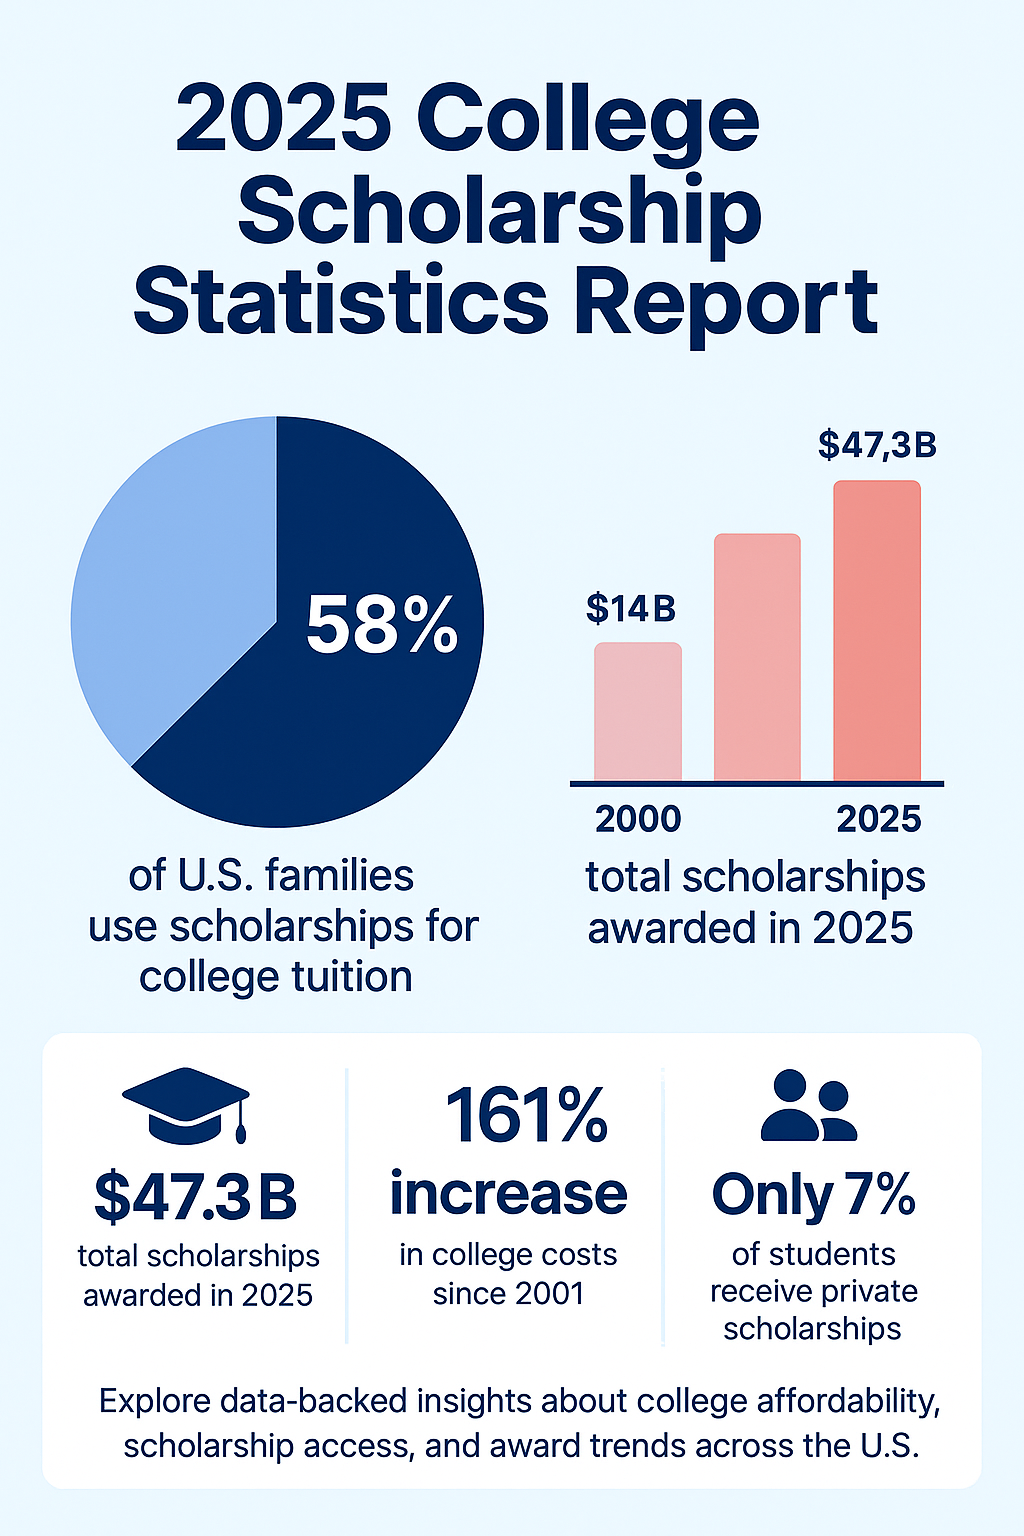
- Family Utilization: Each year, 58% of American families rely on scholarships to assist with covering a portion of college tuition costs.
- Average Aid for First-Time Undergraduates: Students receive about $14,890 per year in scholarships and grants.
- Full-ride Scholarships: Just 0.1% of students receive full-tuition awards.
- Majority Share of Scholarships by GPA: 30% of all scholarships in the US are awarded to students with a GPA between 3.0 and 3.4.
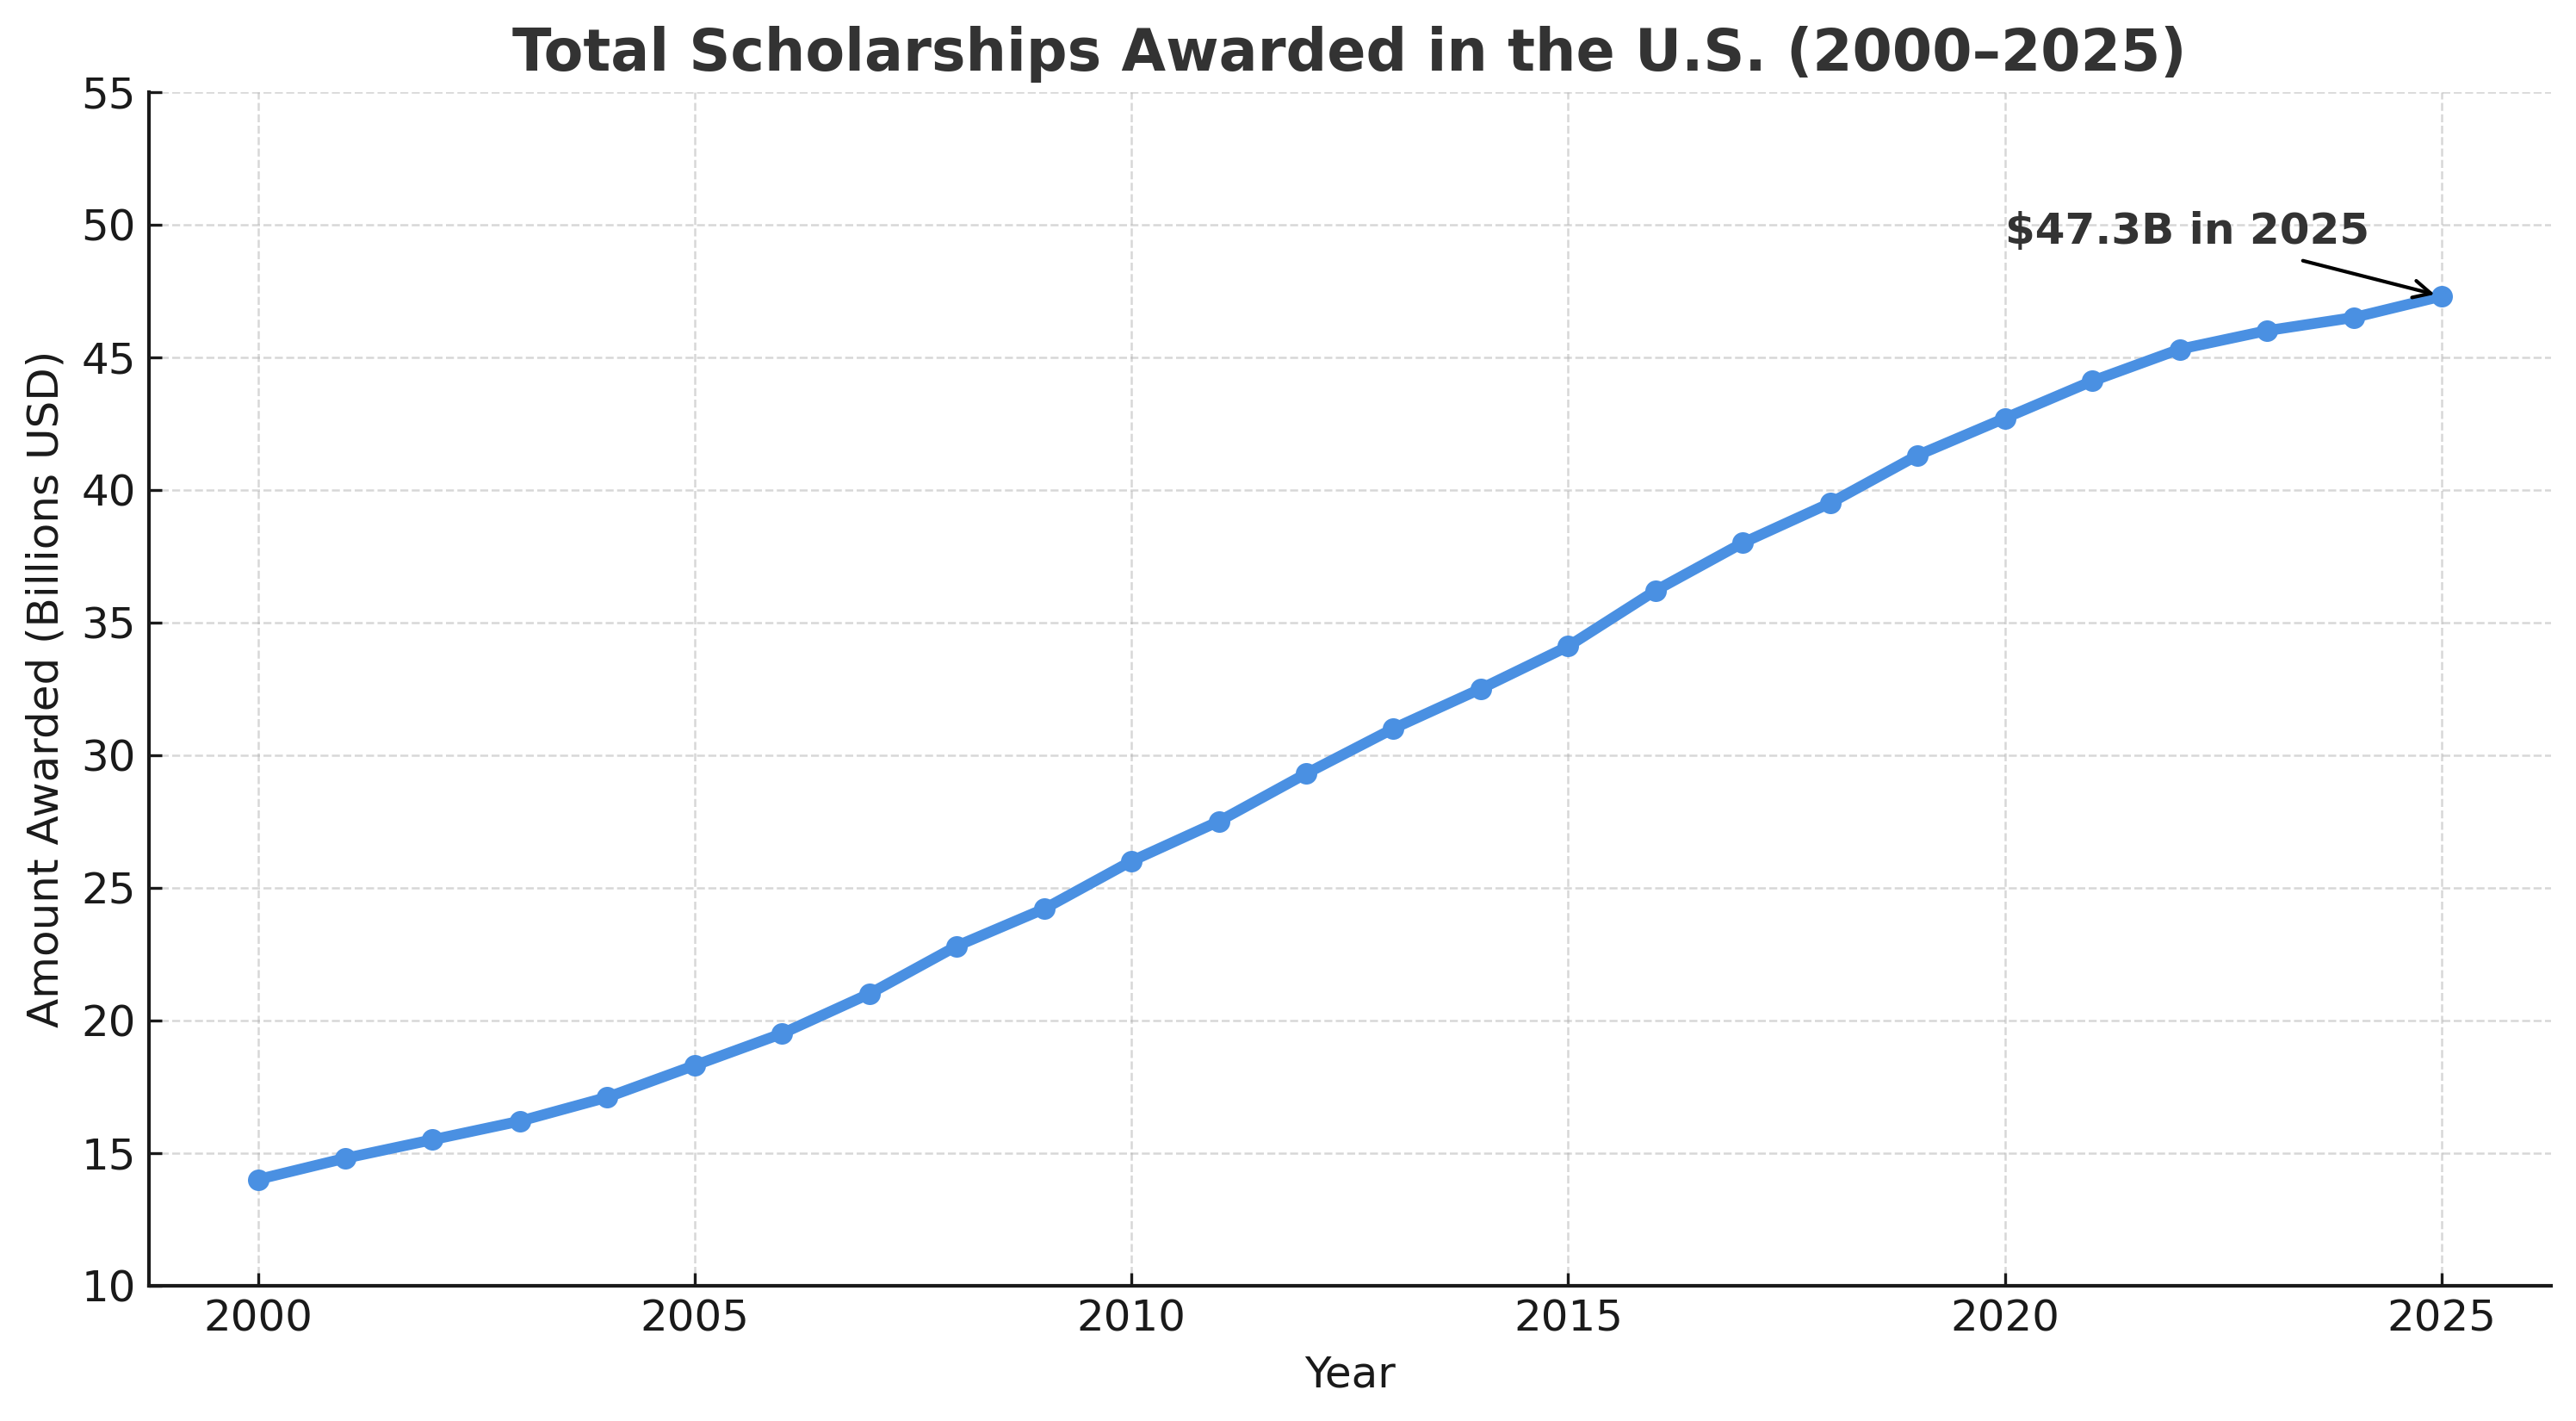
- Total Scholarships Awarded: Over 1.7 million scholarships are distributed annually in the U.S., amounting to approximately $46 billion in aid.
Demographics of Scholarship Recipients
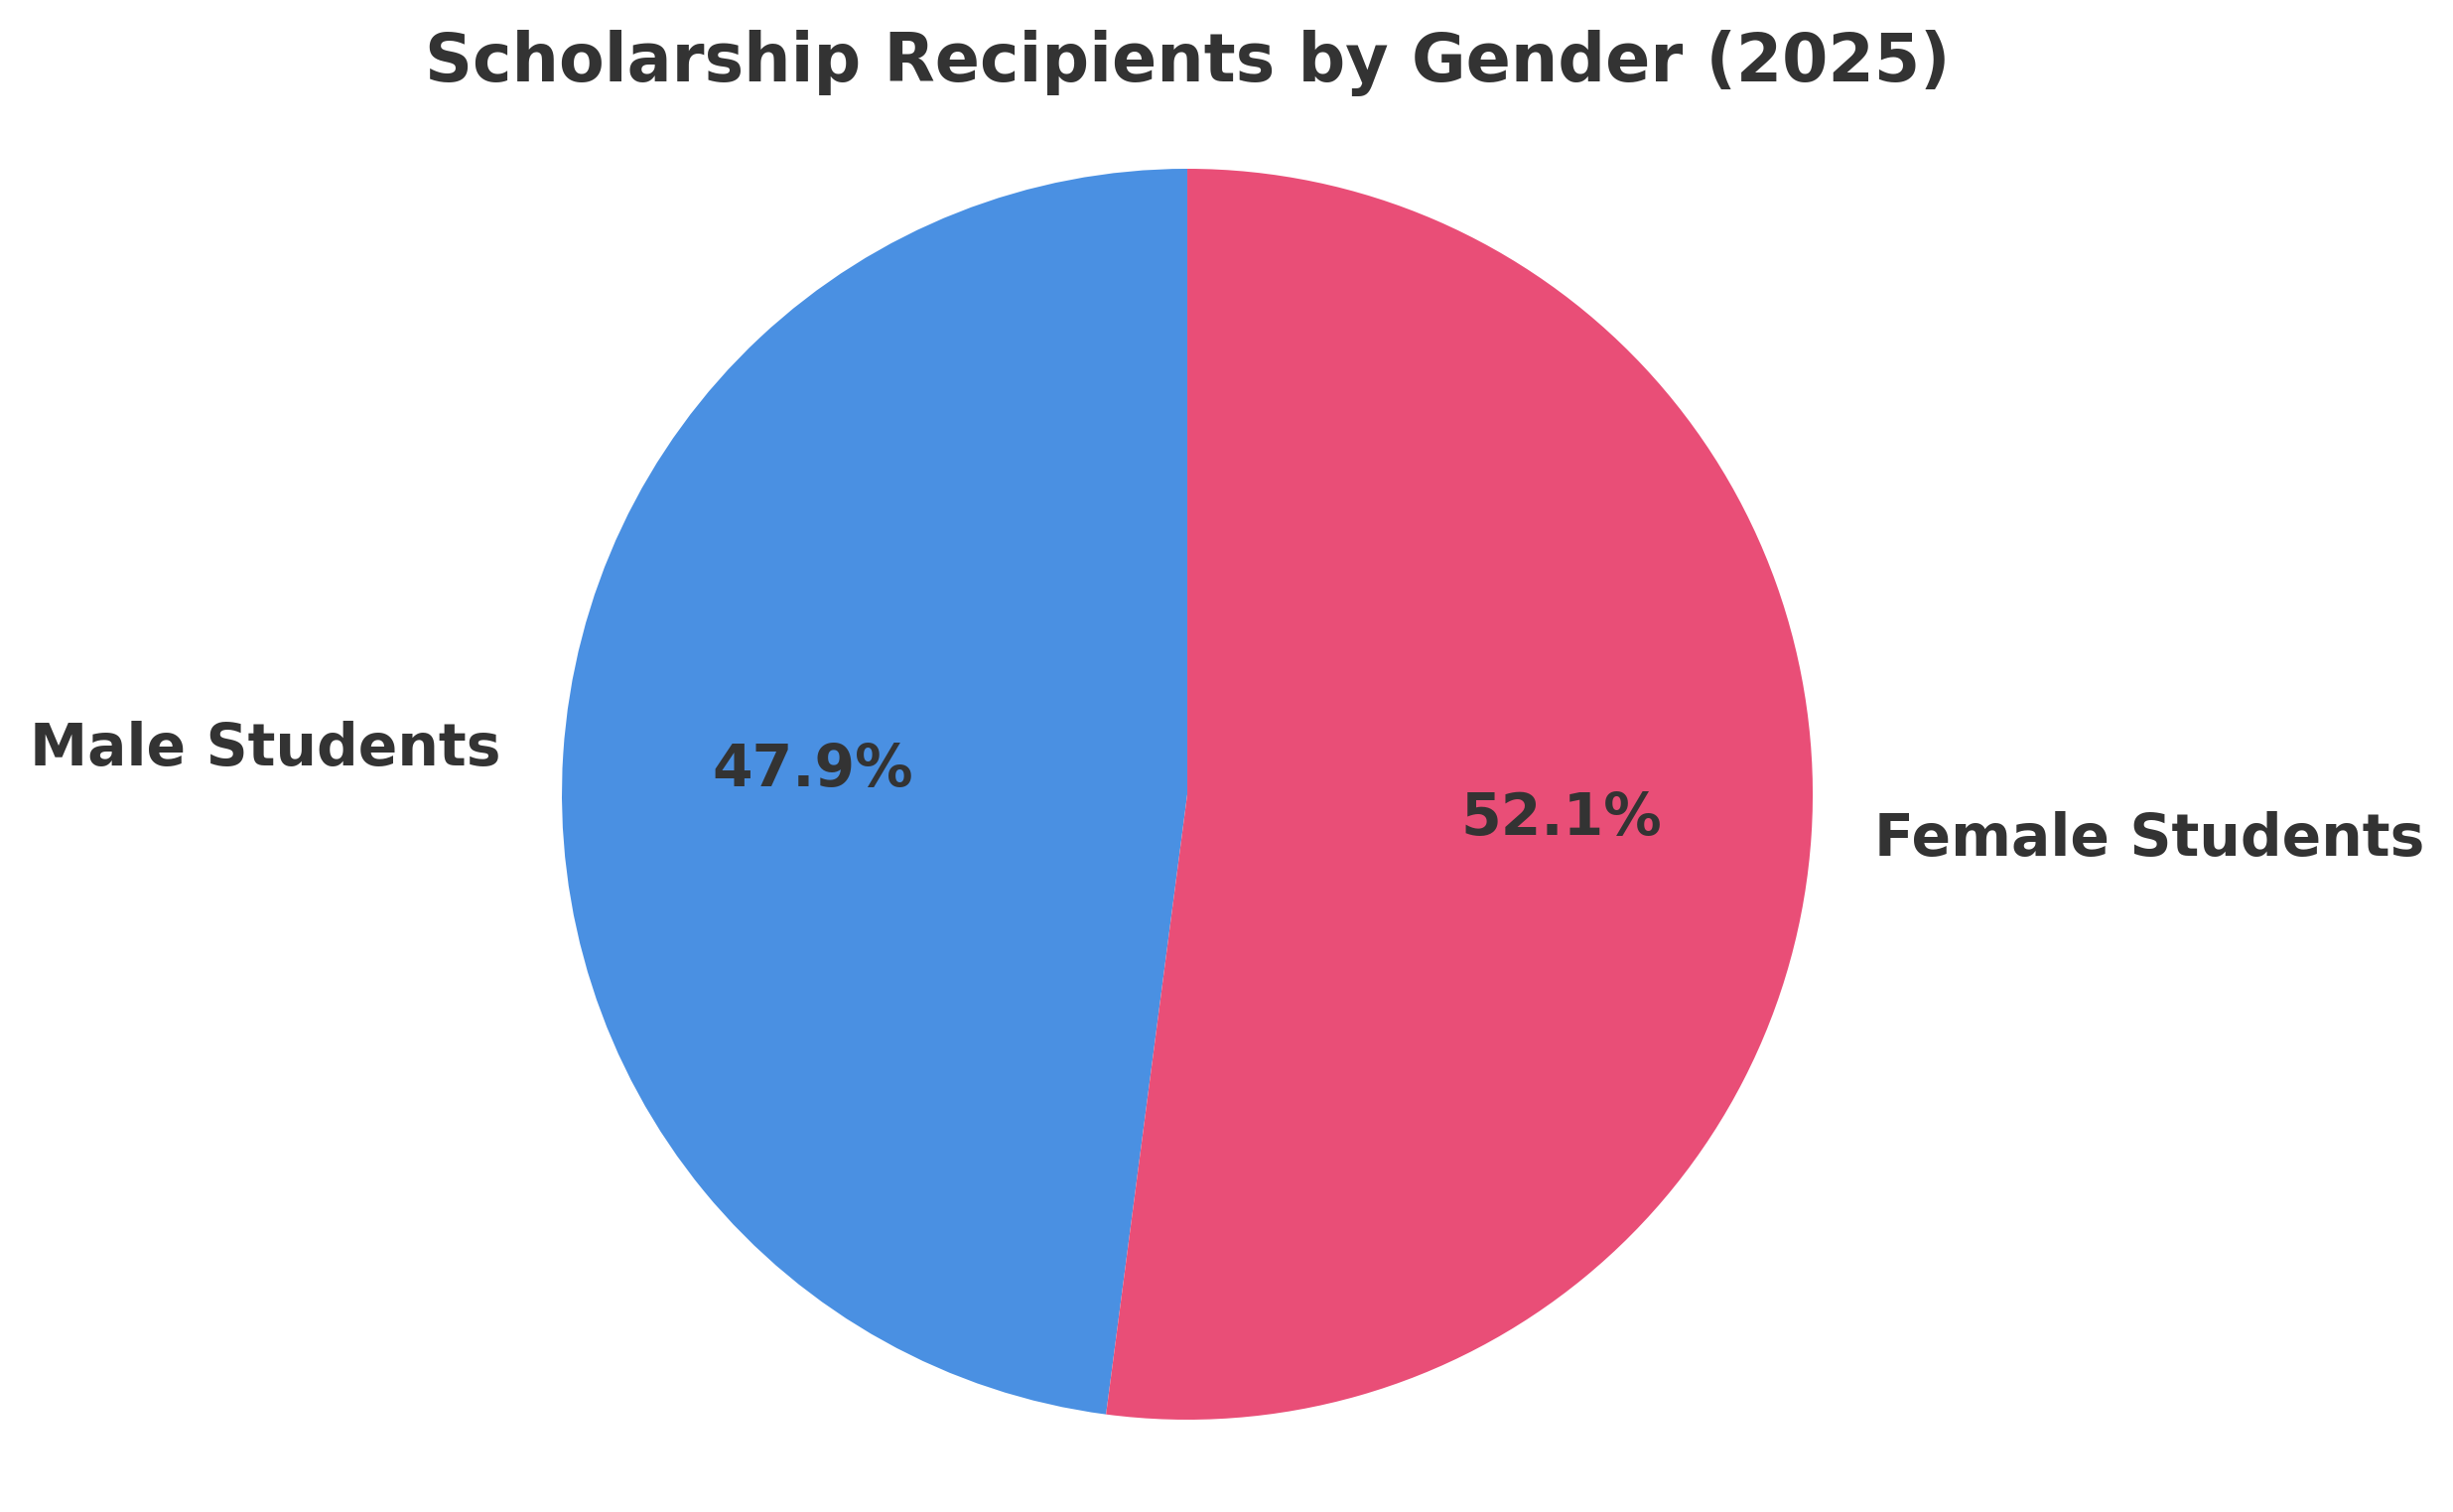
- Gender Distribution:
- 77.4% of male students received scholarships.
- 84.1% of female students received scholarships.
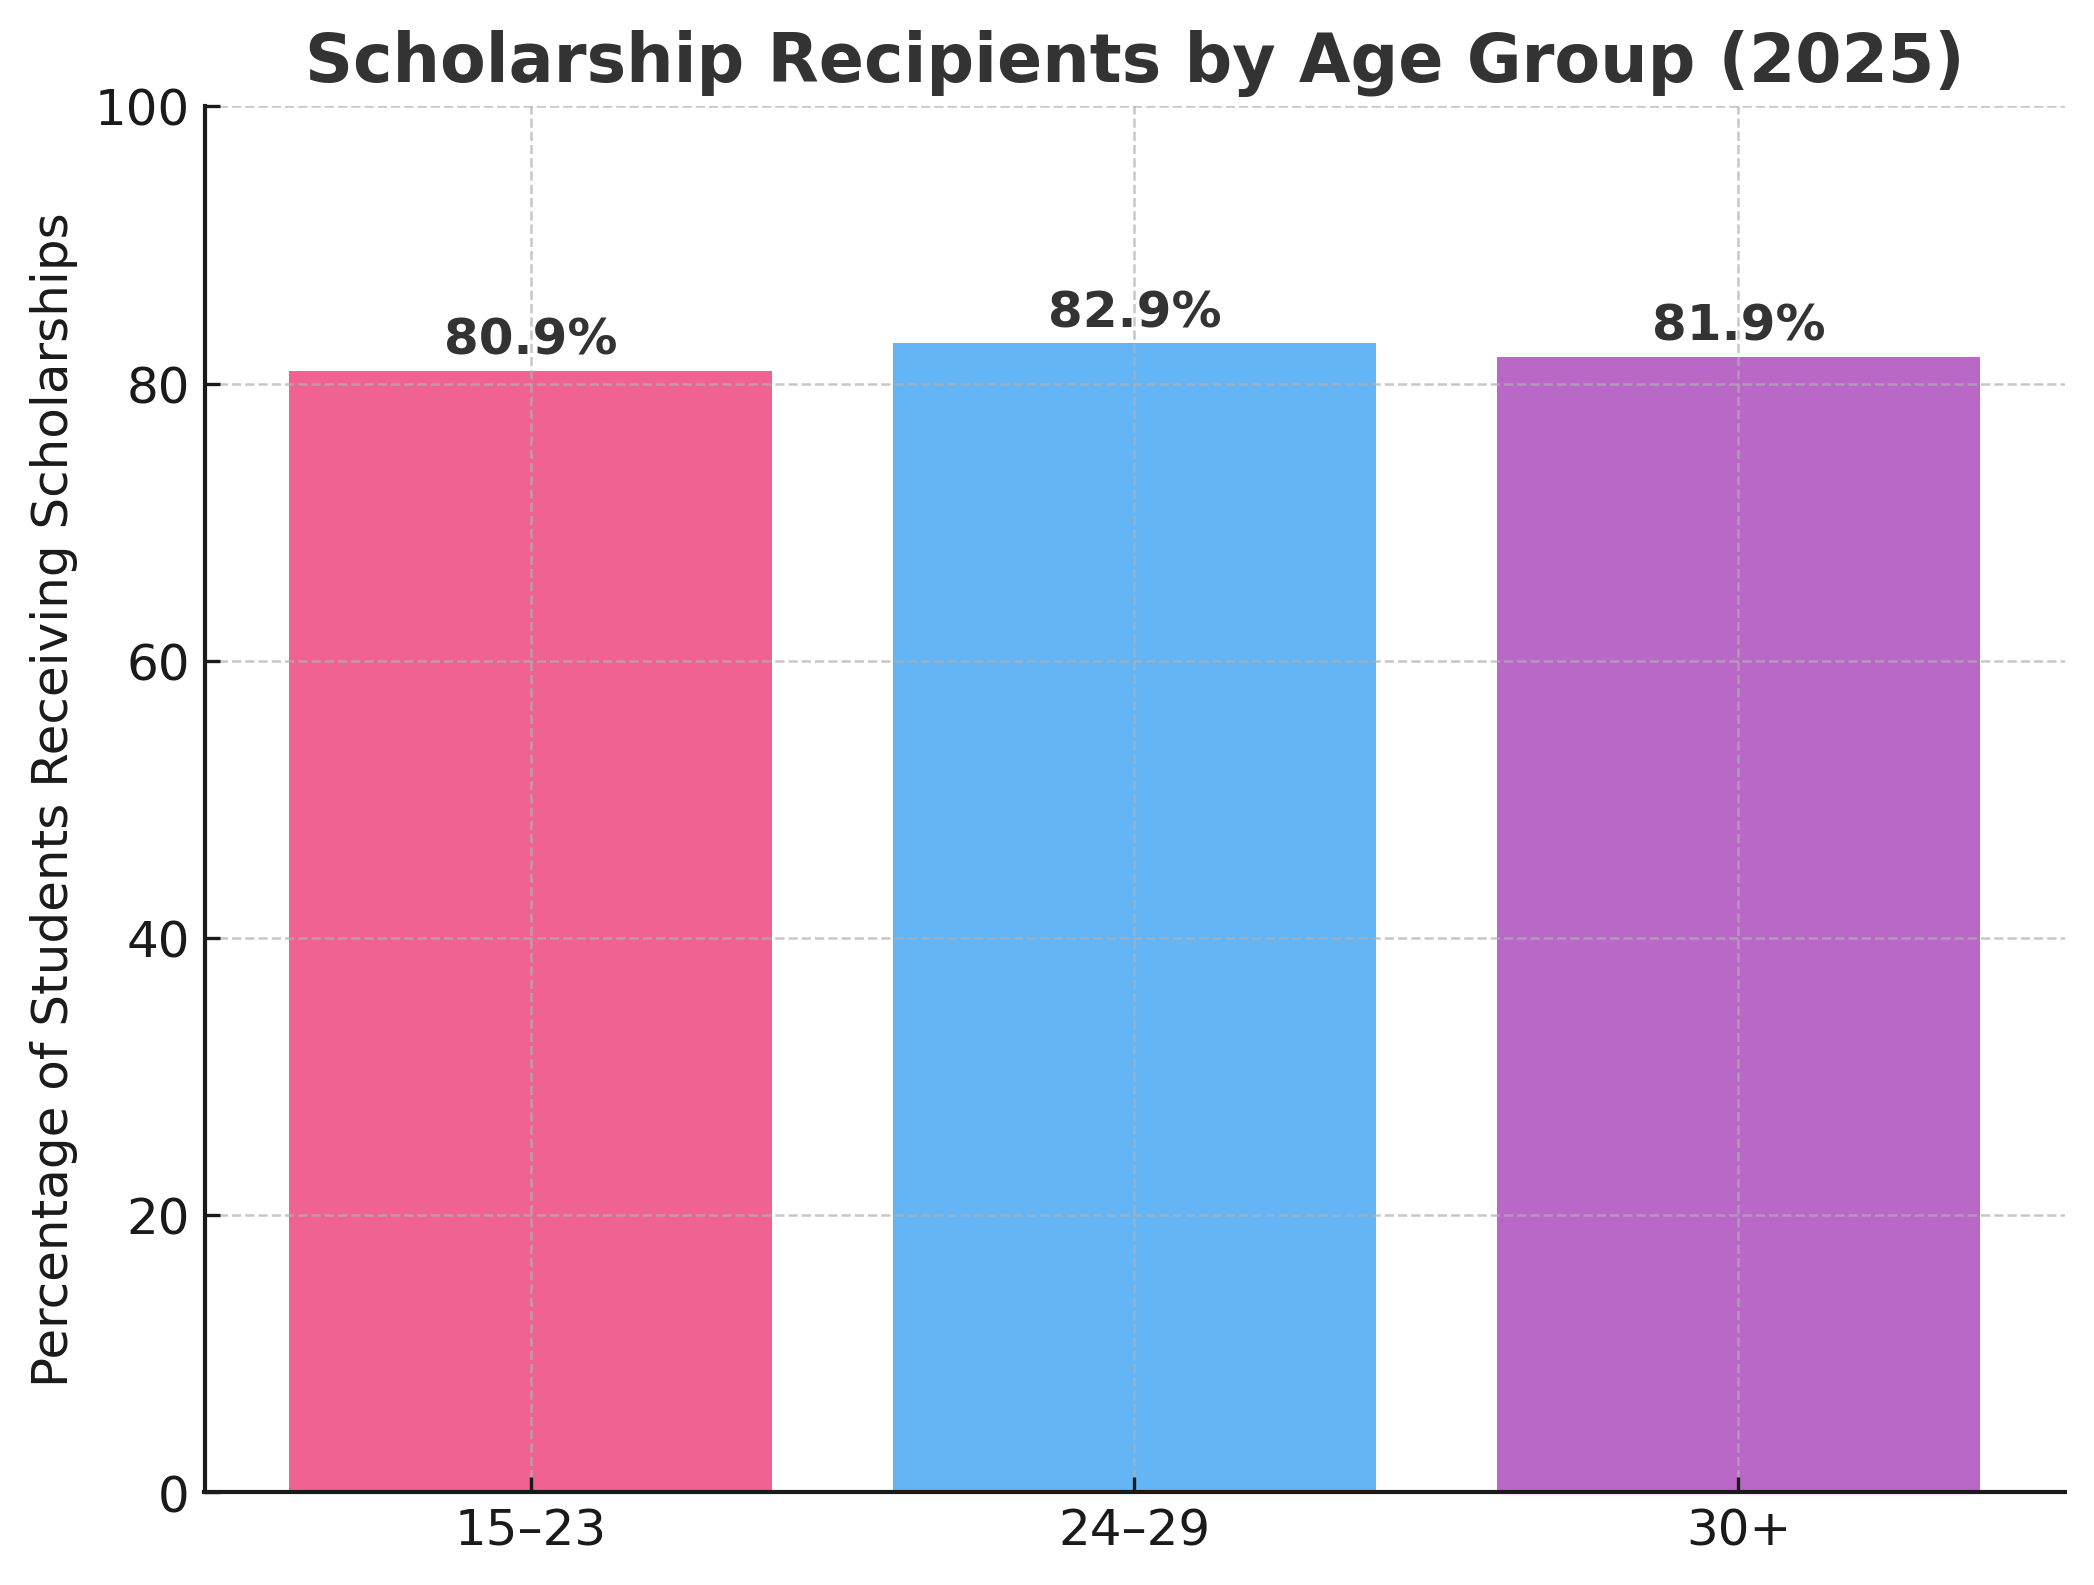
- Age Groups:
- Students aged 24–29: 82.9% received scholarships.
- Students aged 15–23: 80.9% received scholarships.
- Students aged 30 and above: 81.9% received scholarships.
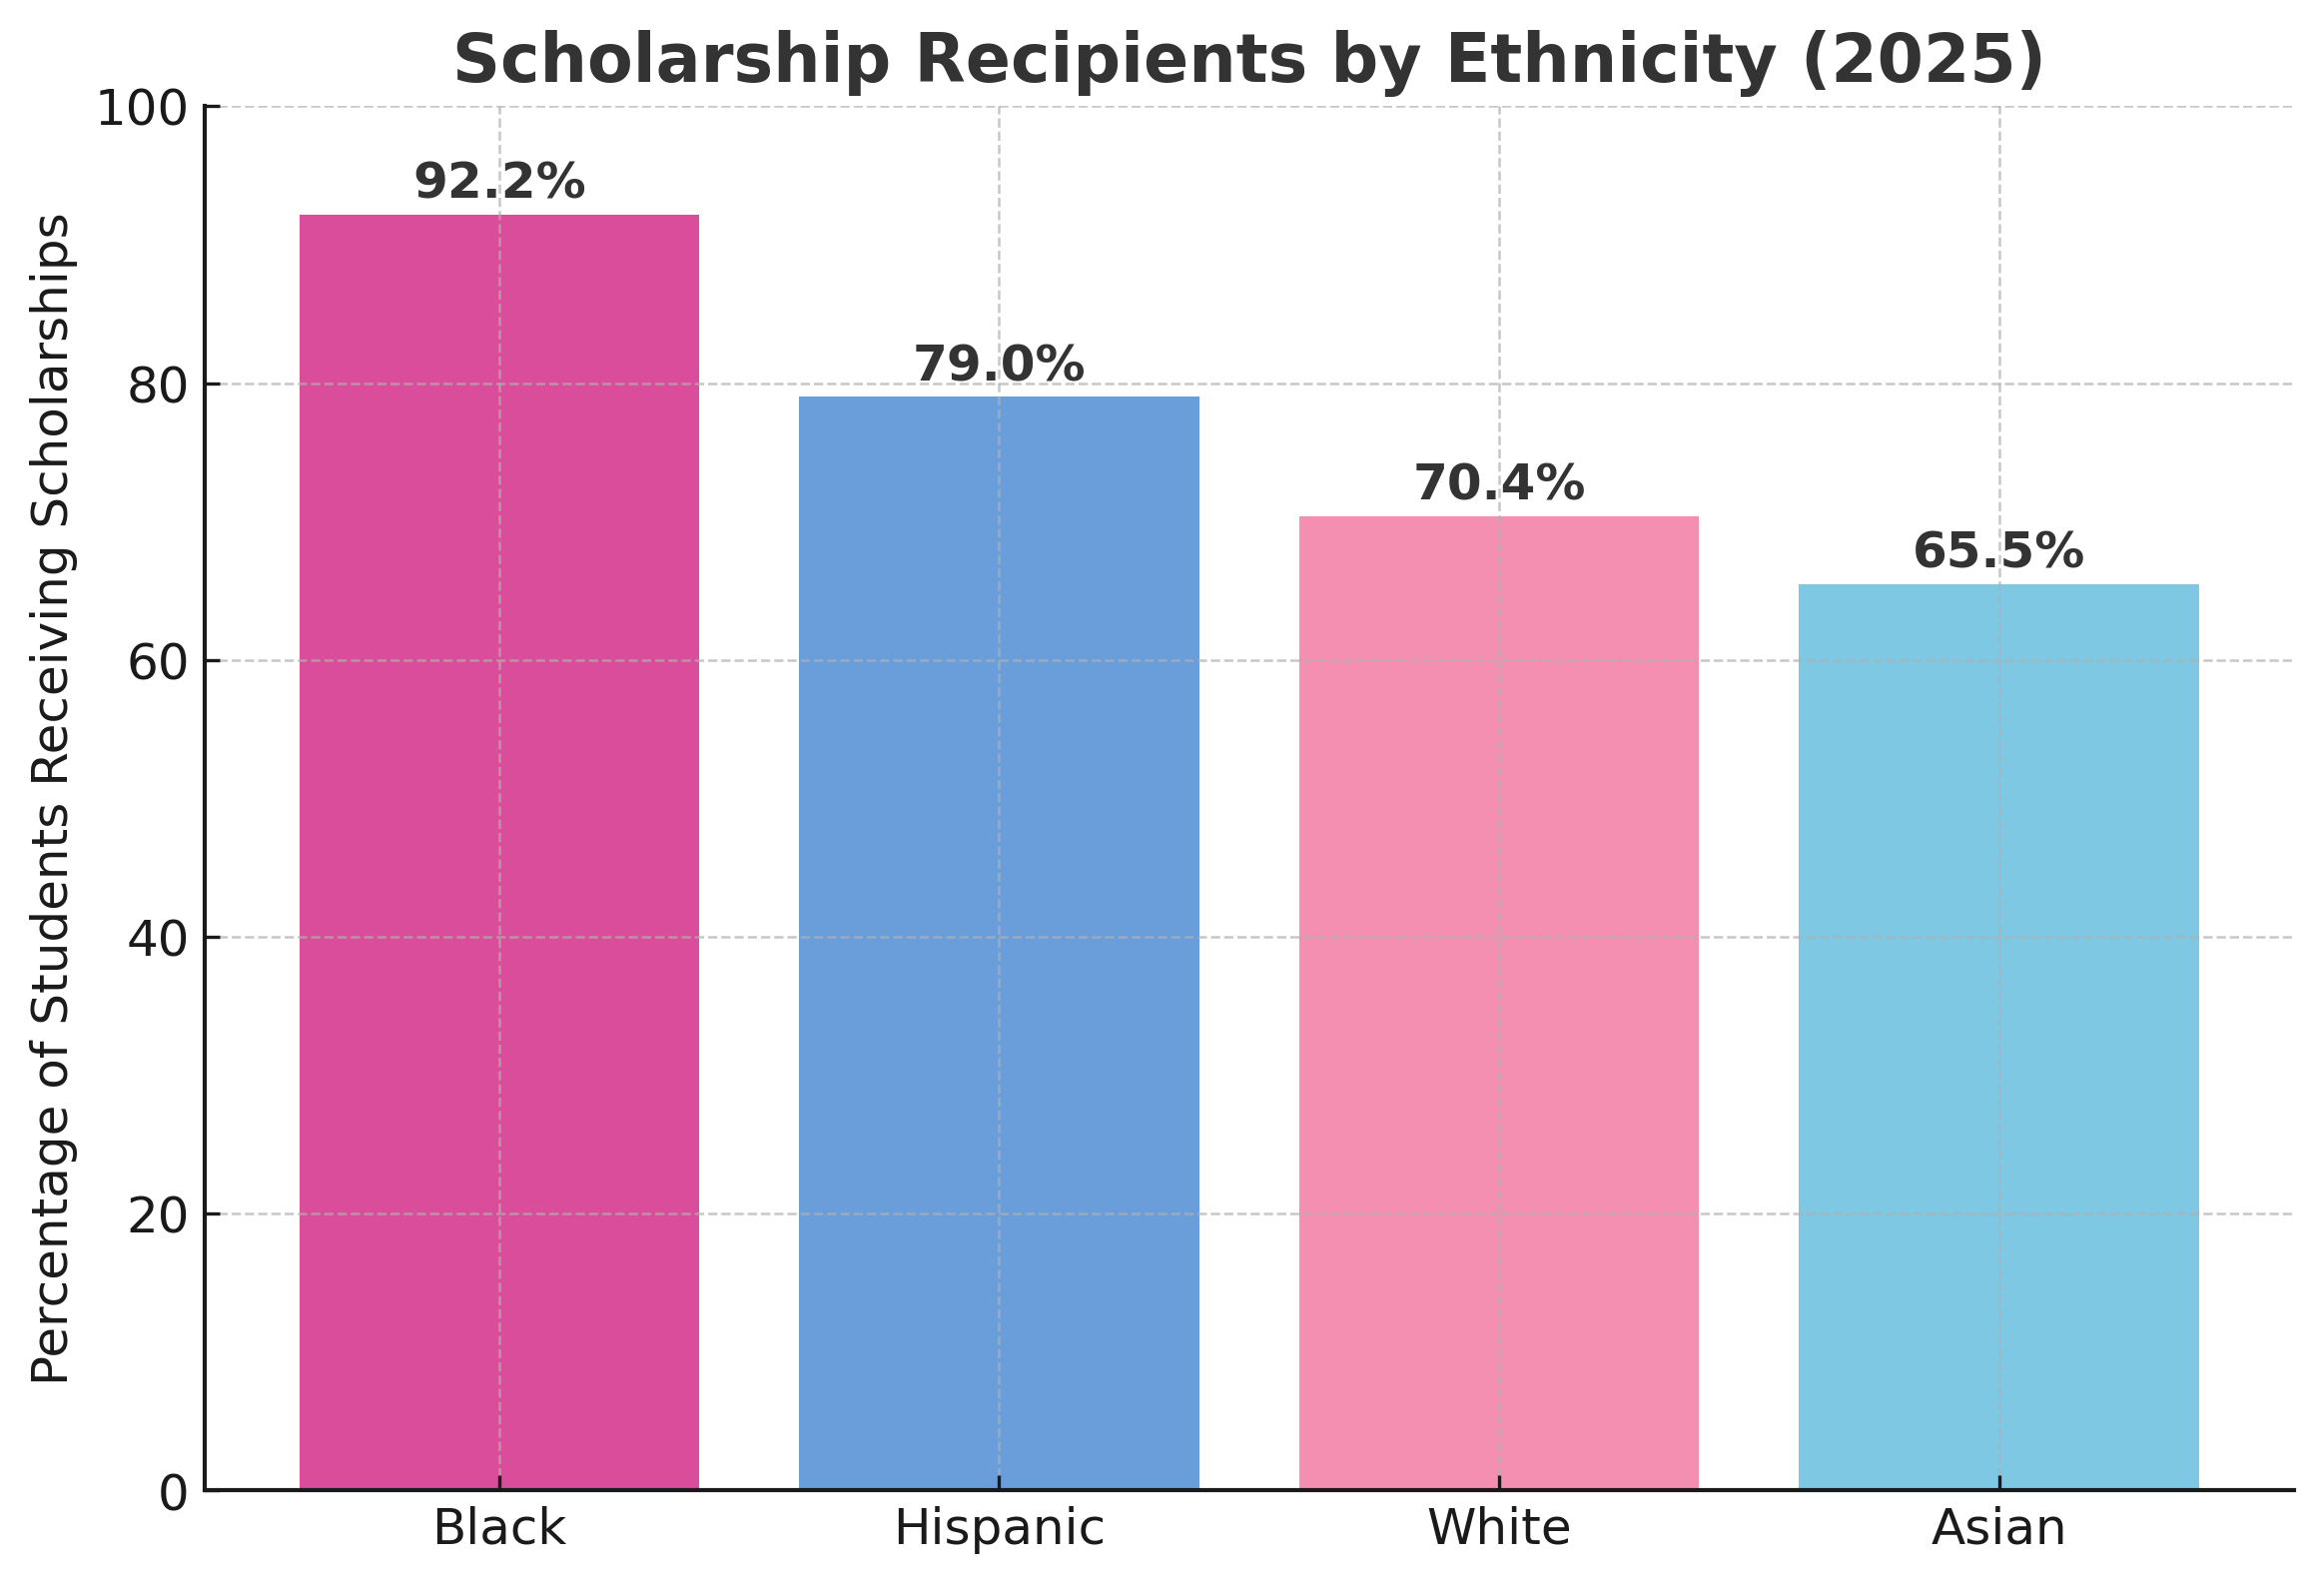
- Ethnicity:
- Black students: 92.2% received scholarships.
- Hispanic students: 79% received scholarships.
- White students: 70.4% received scholarships.
- Asian students: 65.5% received scholarships.
College Costs Report Summary
- The average total cost of college in the 2023-2024 school year was $33,730.
- The cost of college has increased by 161.1% from 2001 to 2024.
- The average total cost of college in the 2000-2001 school year was $12,922

Affordability Report Summary
- 71.4% of all undergraduates receive some aid, either from federal or nonfederal sources.
- The U.S. Department of Education estimates that $39.3 billion will be distributed through Federal Pell Grants in 2025.

Average College Costs 2023-2024
- Average cost of attendance at an in-state, public, 4-year college: $22,290
- Average cost of attendance at an out-of-state, public, 4-year college: $32,656
- Average cost of attendance at a private, for-profit, 4-year college: $33,923
- Average cost of attendance at a private, nonprofit, 4-year college: $46,052
- Average cost of attendance at all 4-year colleges: $33,730
Average College Costs 2022-2023
- The average total cost of attendance at a four-year public institution in the 2022-2023 school year was $22,389.
- The average total cost of attendance at a four-year private institution in the 2022-2023 school year was $49,654.
- The average total cost of attendance at a two-year public institution in the 2022-2023 school year was $11,953.
- The average total cost of attendance at a two-year private institution in the 2022-2023 school year was $28,792.
Student Loan Debt Statistics
- In 2024, Americans owed $1.6 trillion in student loans.
- Student loan debt increased by 42% from 2014 to 2024.
- 25% of adults under 40 hold student loan debt.
- 36% of adults under 40 who had a 4-year college degree or higher had outstanding student loan debt.
- The median borrower with outstanding debt owed between $20,000 and $24,999.
- The average bachelor’s degree holder who borrowed student loans owed between $20,000 and $24,999
Student Loan Rates and Statistics
- The average interest rate for a 5-year variable private student loan in March 2025 is 6.04%.
- The average interest rate for a 10-year fixed private student loan in March 2025 is 7.60%.
- The fixed interest rate for federal direct subsidized loans and direct unsubsidized loans for undergraduate students is 6.53%.
- The fixed interest rate for federal direct unsubsidized loans for graduate or professional students is 8.08%.
- The fixed interest rate for federal direct PLUS loans for parents and graduate or professional students is 9.08%.

General Scholarship Funding and Distribution
- 58% of American families use scholarships to pay for some college tuition costs each year.
- Over 1.7 million scholarships are awarded each year.
- The largest federal scholarship fund, the Pell Grant, provides support to 7.5 million students each year.
- The U.S. Department of Education awards around $46 billion through scholarships each year.
- 16% of students receive state scholarships, and 13% of students receive private scholarships during their postsecondary education.
- Around one in eight college students will receive a scholarship.
- The average student has a 12.5% chance of winning a scholarship of any monetary value.
- Of the students who receive scholarships, over 97% receive less than $2,500 in funding.
- Only 0.2% of students who receive scholarships are awarded $25,000 or more.
- Around 0.1% of students receive full-ride scholarships, which cover the total cost of education and living expenses.
- The average high school student qualifies for up to 100 scholarships.

Average State Aid Projections for 2025
- The U.S. Department of Education estimates that $39.3 billion will be distributed through Federal Pell Grants.
- The U.S. Department of Education estimates that $910 million will be distributed through Federal Supplemental Education Opportunity Grants.
- The U.S. Department of Education estimates that $1.2 billion will be distributed through Federal Work-Study programs.
- In total, the U.S. Department of Education estimates that $41.4 billion will be distributed through all federal postsecondary education programs.
Largest Federal Scholarship Fund: Pell Grant Statistics
- Founded in 1972, the Pell Grant provides support for around 7 million students each year (1/3 of undergraduate students).
- Over 50 years, the Pell Grant has provided college tuition assistance to 80 million low-income students.
- In the 1975-76 academic year, the maximum Pell Grant award was worth over 75% of the average cost of attendance at a four-year public university. This included tuition, fees, and living expenses.
- In the 2022-2023 academic year, the maximum Pell Grant award was worth 30% of the average cost of attendance at a four-year public university.
- In the 2022-2023 academic year, the average award provided by the Pell Grant to undergraduate university students was $4,875.
- In the 2021-2022 academic year, 33% of bachelor’s degree-granting institutions and 49% of community colleges were affordable to Pell Grant recipients. Affordability was measured by the National College Attainment Network.

Profile of Students Receiving Financial Aid in 2020
- 71.4% of all undergraduates receive some aid, either from federal or nonfederal sources.
- Of female undergraduate students, 59.9% received federal aid, and 51.4% received nonfederal aid.
- Of male undergraduate students, 50.8% received federal aid, and 49.3% received nonfederal aid.
- 57.7% of American Indian/Alaska Native undergraduate students received federal student aid.
- 47.2% of Asian undergraduate students received federal student aid.
- 71.7% of Black undergraduate students received federal student aid.
- 57.6% of Hispanic undergraduate students received federal student aid.
- 56.6% of Pacific Islander undergraduate students received federal student aid.
- 52.9% of White undergraduate students received federal student aid.
- 54.3% of undergraduate students identifying as two or more races received federal student aid.
- White students have a 14.2% chance of receiving a scholarship, while minority students’ chances of winning a scholarship are 11.2%.

Athletic Scholarships
- The total value of scholarships in NCAA I schools was $2.76 billion in 2020.
- The total value of scholarships in NCAA II schools was $752 million in 2020.
- Football was the college sport with the highest participation, with 899 participating schools and 93,776 total athletes.
- Soccer was the college sport with the second-highest participation, with 1,733 participating schools and 84,087 total athletes.
Scholarship Outcomes
- A survey of California high school seniors found that students eligible for performance-based scholarships allocate more time for educational activities, consequently decreasing time spent on other activities like work and leisure.
- Data from two New York City community college scholarship programs shows that receiving a scholarship encouraged full-time enrollment. Full-time enrollment increased by 4.1% in the first semester students received a scholarship, and increased by 6% in the second semester.
- A study on the effects of the Georgia HOPE scholarship, which provides grade incentives to students but not credit incentives, found that the scholarship reduced the likelihood of students registering for a full credit load. In addition, the scholarship increased the likelihood that students would withdraw from courses. While not conclusive regarding the effects of all scholarships on students, this may be an example of the unintended effects scholarships can have in motivating educationally unproductive habits.
State Aid Resources for Students
Sources
- Average Undergraduate Tuition for Full-Time Students (1963-64 through 2022-23)
- Average Costs Associated with College Attendance for Selected Years (2023-2024)
- Federal Student Aid | U.S Department of Education
- Best Private Student Loans Of 2025
- Interest Rates and Fees for Federal Student Loans
- Scholarship America
- BigFuture Scholarships Are Expanding to Include Students in the Class of 2027
- 5 Facts About Student Loans
- Student Loans Owned and Securitized
- What is the average amount of grant or scholarship aid from the federal government, state/local government, or the institution awarded to full-time, first-time undergraduate students?
- Fiscal Year 2023-FY 2025 President's Budget State Tables for the U.S. Department of Education
- Percentage of undergraduates receiving financial aid, by type and source of aid and selected student characteristics: Academic year 2019-20
- Can Scholarships Alone Help Students Succeed?
- Total Athletic Scholarships & average per athlete | Scholarship Stats.com
- Pell Grants - National College Attainment Network
- College Affordability - National College Attainment Network
- Financial Aid: What is the average amount of Pell grants awarded to undergraduate students?
- EconPapers: Student Responses to Merit Scholarship Retention Rules
- U.S. Scholarship Statistics: The Latest Data, Facts, And Costs
- Financial Incentives and Educational Investment: The Impact of Performance-Based Scholarships on Student Time Use
- College Scholarship Statistics 2025 (Latest Data & Facts)
- U.S. SCHOLARSHIP STATISTICS: THE LATEST DATA, FACTS AND COSTS
- Scholarship Statistics